Visualizing Density
Visualizing Density is a pilot project created by the Canadian Urban Institute to help planners, designers, elected officials, residents’ groups, and private sector builders design more complete communities and adapt existing ones over time. We want this website to be a contribution to the ongoing conversation about managing growth and building great communities in Ontario.
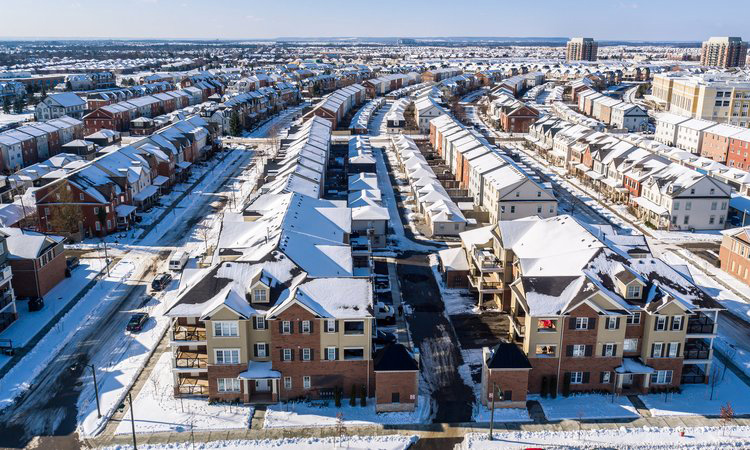
We chose five communities to visualize what the built-form looks like in relation to density targets set out in the Provincial Growth Plan. The visuals and analysis in the 5 case studies also encourage users to look beyond buildings and consider the attributes that work with density to make complete communities. We chose 6 key drivers of complete communities to help us illustrate this.
Our methodology calculates the density (residents and jobs per hectare) at the neighbourhood and block scale in 5 case studies. This approach can be easily replicated and used by municipalities, university courses, or volunteers to measure and explore density or undertake additional case studies to share on this website. The case studies could also be updated to assess each area’s progress towards becoming a complete community.
Details
Type:
Initiative
Date:
Partners:
This website was created by the Canadian Urban Institute with support from the Ontario Growth Secretariat through the Places to Grow Implementation Fund.